EARNINGS RELEASE
H1, 2023
AlRayan Bank REPORTS A NET PROFIT OF QAR 765 MILLION FOR H1 2023

- Total Income reached QAR 2.27 billion, compared to QAR 1.55 billion for the same period last year;
- Net financing assets closed at QAR 117 billion, versus to QAR 118 billion at year-end 2022;
- Deposits closed at QAR 94 billion, compared to QAR 97 billion as at Q4 2022;
- The Capital Adequacy ratio stood at 20.73%;
Doha, July 17, 2023:
AlRayan Bank Q.P.S.C today released its consolidated financial statements for the six-month period ended 30 June 2023 with a Net Profit attributable to the equity holders of the bank of QAR 765 million.
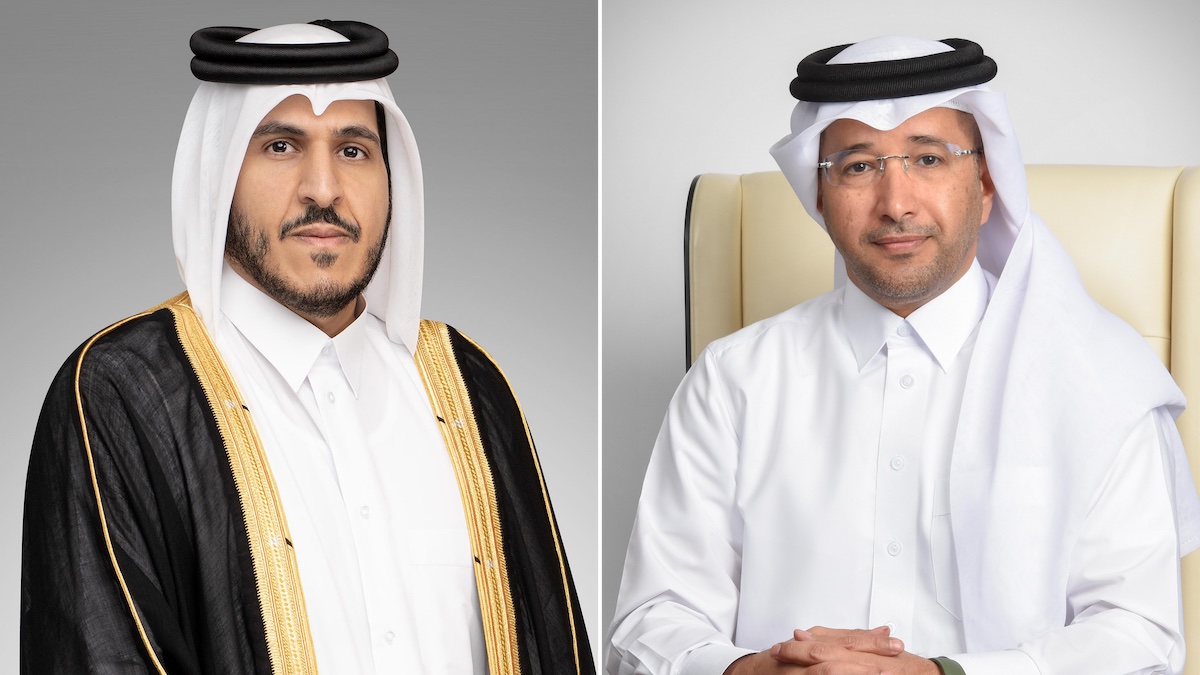
His Excellency Sheikh Mohammed Bin Hamad Bin Qassim Al Thani, Chairman of the Board stated:
Total Income reached QAR 4.61 billion for the six months ending June 2023. The bank has a healthy capital base, strong funding and a liquidity coverage ratio of 129% comfortably higher than the regulatory requirement. During this quarter, Masraf played an active part in supporting local currency market issuance, by investing in sovereign T-bills and Sukuk, which positively contributed to its investment’s profitability.
Commenting on H1 2023 performance, Fahad Bin Abdulla Al Khalifa, Group Chief Executive Officer said:
We are pleased to announce a net profit for the first half of 2023, of QAR 765 million, in line with our expectations. We continue to prioritize prudent risk management, enriching the non-performing coverage to address legacy issues, and preservation of margins. We have recently launched our Premier Banking offering, which delivers an enhanced value proposition and personalized level of service to both our new and existing loyal client base. Our focus remains on improving efficiency through adoption of technologies, and delivering continuous improvement in the customer journey.
Key Financial highlights:
| Balance Sheet -QAR billion | H1-2023 | Q4-2022 | Change |
|---|---|---|---|
| Total Assets | 160 | 168 | -4% |
| Financing assets | 112 | 118 | -5% |
| Investments | 35 | 32 | 9% |
| Deposits | 89 | 97 | -9% |
| Total Equity | 24.2 | 24.3 | -0.5% |
| Income Statement - QAR million | H1-2023 | H1-2022 | Change |
|---|---|---|---|
| Total income | 4,613 | 3,269 | 41% |
| Net operating profit | 1,813 | 2,302 | -21% |
| Operating expenses | 467 | 620 | 23% |
| Net Impairment Charges | 553 | 661 | 16% |
| Net profit attributable to shareholders | 765 | 1,000 | -24% |
| Earnings Per Share (QAR) | 0.082 | 0.108 | -24% |
| Group ratios | H1-2023 | H1-2022 |
|---|---|---|
| Efficiency (%) | ||
| Cost to Income | 26.7% | 27.5% |
| Loan Quality | ||
| Non-Performing loans (QAR million) | 7,459 | 2,633 |
| NPL ratio (%) | 6.41% | 2.17% |
| Capital Management (%) | ||
| Capital adequacy ratio (CAR) | 21.35% | 20.00% |